Huge information is generated by the end-users with the help of technology. This information helps organizations and end-users to think in a new way and innovate new things. However, presenting this massive data is a complex task and requires more time and knowledge.
The visualization technique helps the organization to represent the data in a meaningful format to enable the viewers to understand the data easily. This article explains about data visualization, the components, the benefits and challenges, and future trends in data visualization
Table of Contents
1. Definition Of Data Visualization
Data visualization is a process of representing a set of data in a systematic format along with its attributes and variables. The data visualization methods are used to simplify the data interpretation process. It provides meaningful insights from the given input of data. Data visualization helps humans to identify patterns and trends and compare data sets to get insights into data.
Data visualization transcribes raw data into information and represents it in visual formats to help organizations in further data analysis and decision-making processes. Good data visualization engages end users and communicates the story effectively. It uses techniques and tools to generate effective graphs and charts as per the requirements.
1.1. Categories of Data Visualization
- Information Visualization: It represents abstract data or business data visually.
- Scientific visualization: It represents physical data like the environment or atmosphere visually.
2. Components Of Data Visualization
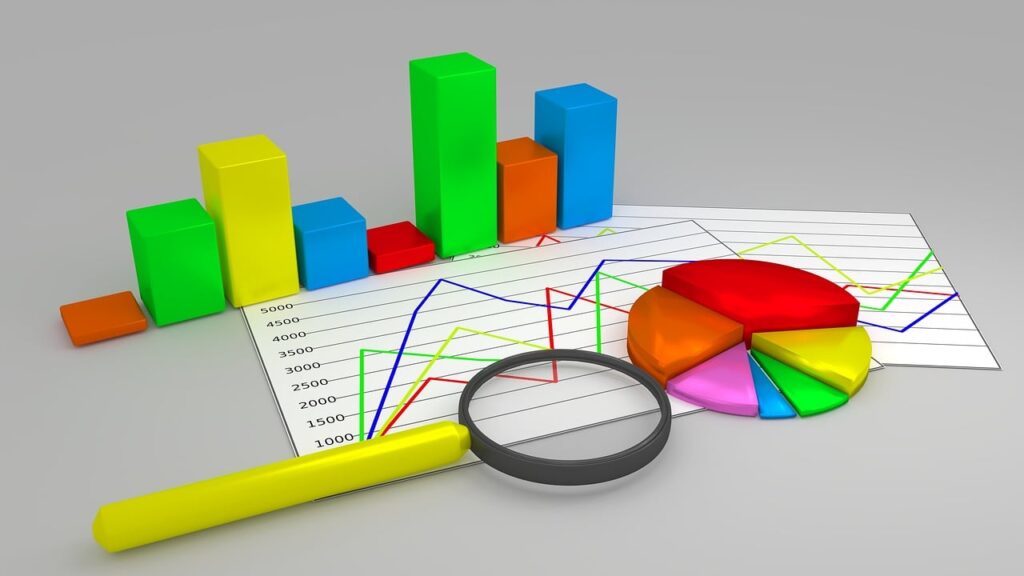
There are various data visualization types present to represent the data in graphical form, such as bar graphs, pie charts, tabular forms, histograms, scatter plots, heat maps, fever charts, area charts, line charts, and frame diagrams.
However, choosing the right visualization is important to reduce complexities. The type of visualization for a data set depends on the characteristics and attributes of the data. The attributes of data play an important role in data visualization. Data attributes are dimensions and measures.
Dimensions help to filter the group of data from a given data set, and measure is an attribute that allows data analysts to create questions to gain insights into data. The dimensions and measures have different names in different fields, like dependent variables, independent variables, and metrics.
The type of data also has an impact on data visualization, such as temporal data, geographical data, continuous data, original data, and categorical data. For applying data visualization, the data should be in the same format. So, the data types must be converted into the same types using techniques like drilling down, rollups, pivoting, reducing dimensionality, and clustering. The actionable keywords also help in choosing the right visualization for data sets.
3. Benefits of Data Visualization
Data visualization is one of the best tools to convey complex data in a simple format. It helps organizations to understand trends, market conditions, and consumer behaviour, explore threats and opportunities, and many more. It benefits every industry. Some of the advantages of data visualization are:
- It improves the decision-making capabilities of organizations by providing information insights to understand their position in the market. Companies can change their business processes or innovate new ideas to increase revenue.
- It helps to increase return on investments by providing information regarding positive and negative elements in business processes.
- It reduces misconceptions and mistakes in business flow by communicating business information clearly to shareholders and stakeholders.
- It saves time and resources for the organization by providing timely insights. It helps to predict future threats and opportunities to make the firm prepared,
- It increases collaboration among shareholders and stakeholders as the information is presented in an easy graphical format.
4. Challenges In Data Visualization
Data visualization is a great tool that provides valuable insights from raw data. It helps business organizations to analyze big data effectively. However, every coin has two faces. Data visualization can harm more than good if teh input data is inappropriate. Choosing the right technique for the data is very challenging. The raw data can be a mixture of structured and unstructured data. Missing data and duplicate data create challenges in processing data.
Data analyzers try to oversimplify the data to make it simple, which leads to missing information. Every visual representation needs an explanation. Oversimplication leads to miscommunication, resulting in wrong decisions. The analyzer has to know the importance of the 4 V’s, such as volume, velocity, variety, and value of the data. They need to choose the right data visualization technique and tool to get accurate results as per the scenario.
5. Future Trends In Data Visualization
- Data Democratization: Data Democratization means that every business data is accessible to everyone. This helps every employee to create their visual analysis report to understand the business opportunities. Data democratization allows ordinary users to use visual analysis techniques to solve problems and analyze businesses and market trends with no-cost and no-code platforms like Tableau Public.
- Real-time Data Visualization: Visualizing real-time data is another trend that provides real-time business insights. Financial companies use real-time data visualization to understand market fluctuations and make investment decisions. Real-time data visualization is very important in the logistics and transport sectors.
- AI-powered Data Visualization: The combination of AI algorithms and machine learning models helps to find the hidden patterns of data that will provide deep insights to represent visually.
- Storytelling With Data Visualization: storytelling is the new trend that keeps users engaged with creative and visual stories to convey messages. Marketing teams use storytelling techniques to convey brand information to end-users.
- Augmented Reality And Virtual Reality: AR and VR will change the way the information is displayed. It breaks teh barriers to understanding complex data by proving surroundings by taking users into the virtual world of data.
6. Conclusion
Data visualization helps end users understand the insights of complex data sets easily by curating them and representing them in a visual format. Data visualization is used in every field to measure trends, competition, risks, and opportunities. It is a key tool to analyze big data.
The components of data visualization, like dimensions, attributes, actionable keywords, and data types, help to craft a story using proper visualization techniques and tools. It benefits every field with its tremendous features. However, maintaining the quality of large data sets and choosing the right visualization tool is challenging. Data democratization, AR and VR will change data visualization in future.